Running Python in the Browser with Svelte and Pyodide
For years, the division between web development and data science has been clear: JavaScript rules the browser, while Python dominates the backend. If you wanted to run a Pandas analysis or generate a Matplotlib chart, you had to send data to a server, process it, and send the results back.
But with the rise of WebAssembly (WASM), that boundary is blurring.
In this project, I built SveltePy Studio, a fully client-side application that brings the power of Python’s data science stack directly into the browser. By combining SvelteKit for a reactive UI with Pyodide—a port of CPython to WebAssembly—users can upload CSV datasets and generate complex visualizations without a single byte of user data leaving their device.
The application demonstrates how to:
- Implement Web Workers to run the Python kernel. We’ll explain why offloading this heavy computation to a background thread is critical for keeping the UI buttery smooth.
- Mount local files directly into the Python virtual filesystem for instant access.
- Visualize data using Matplotlib to render the results seamlessly within a modern, dark-themed Svelte interface.
Let’s explore how we can bridge the gap between these two ecosystems.
The Application: SveltePy Studio
To demonstrate these capabilities, I built SveltePy Studio, a lightweight playground that lets you visualize data instantly. It’s not meant to replace tools like Tableau or Jupyter, but rather to show how easily Python can be embedded into a web app.
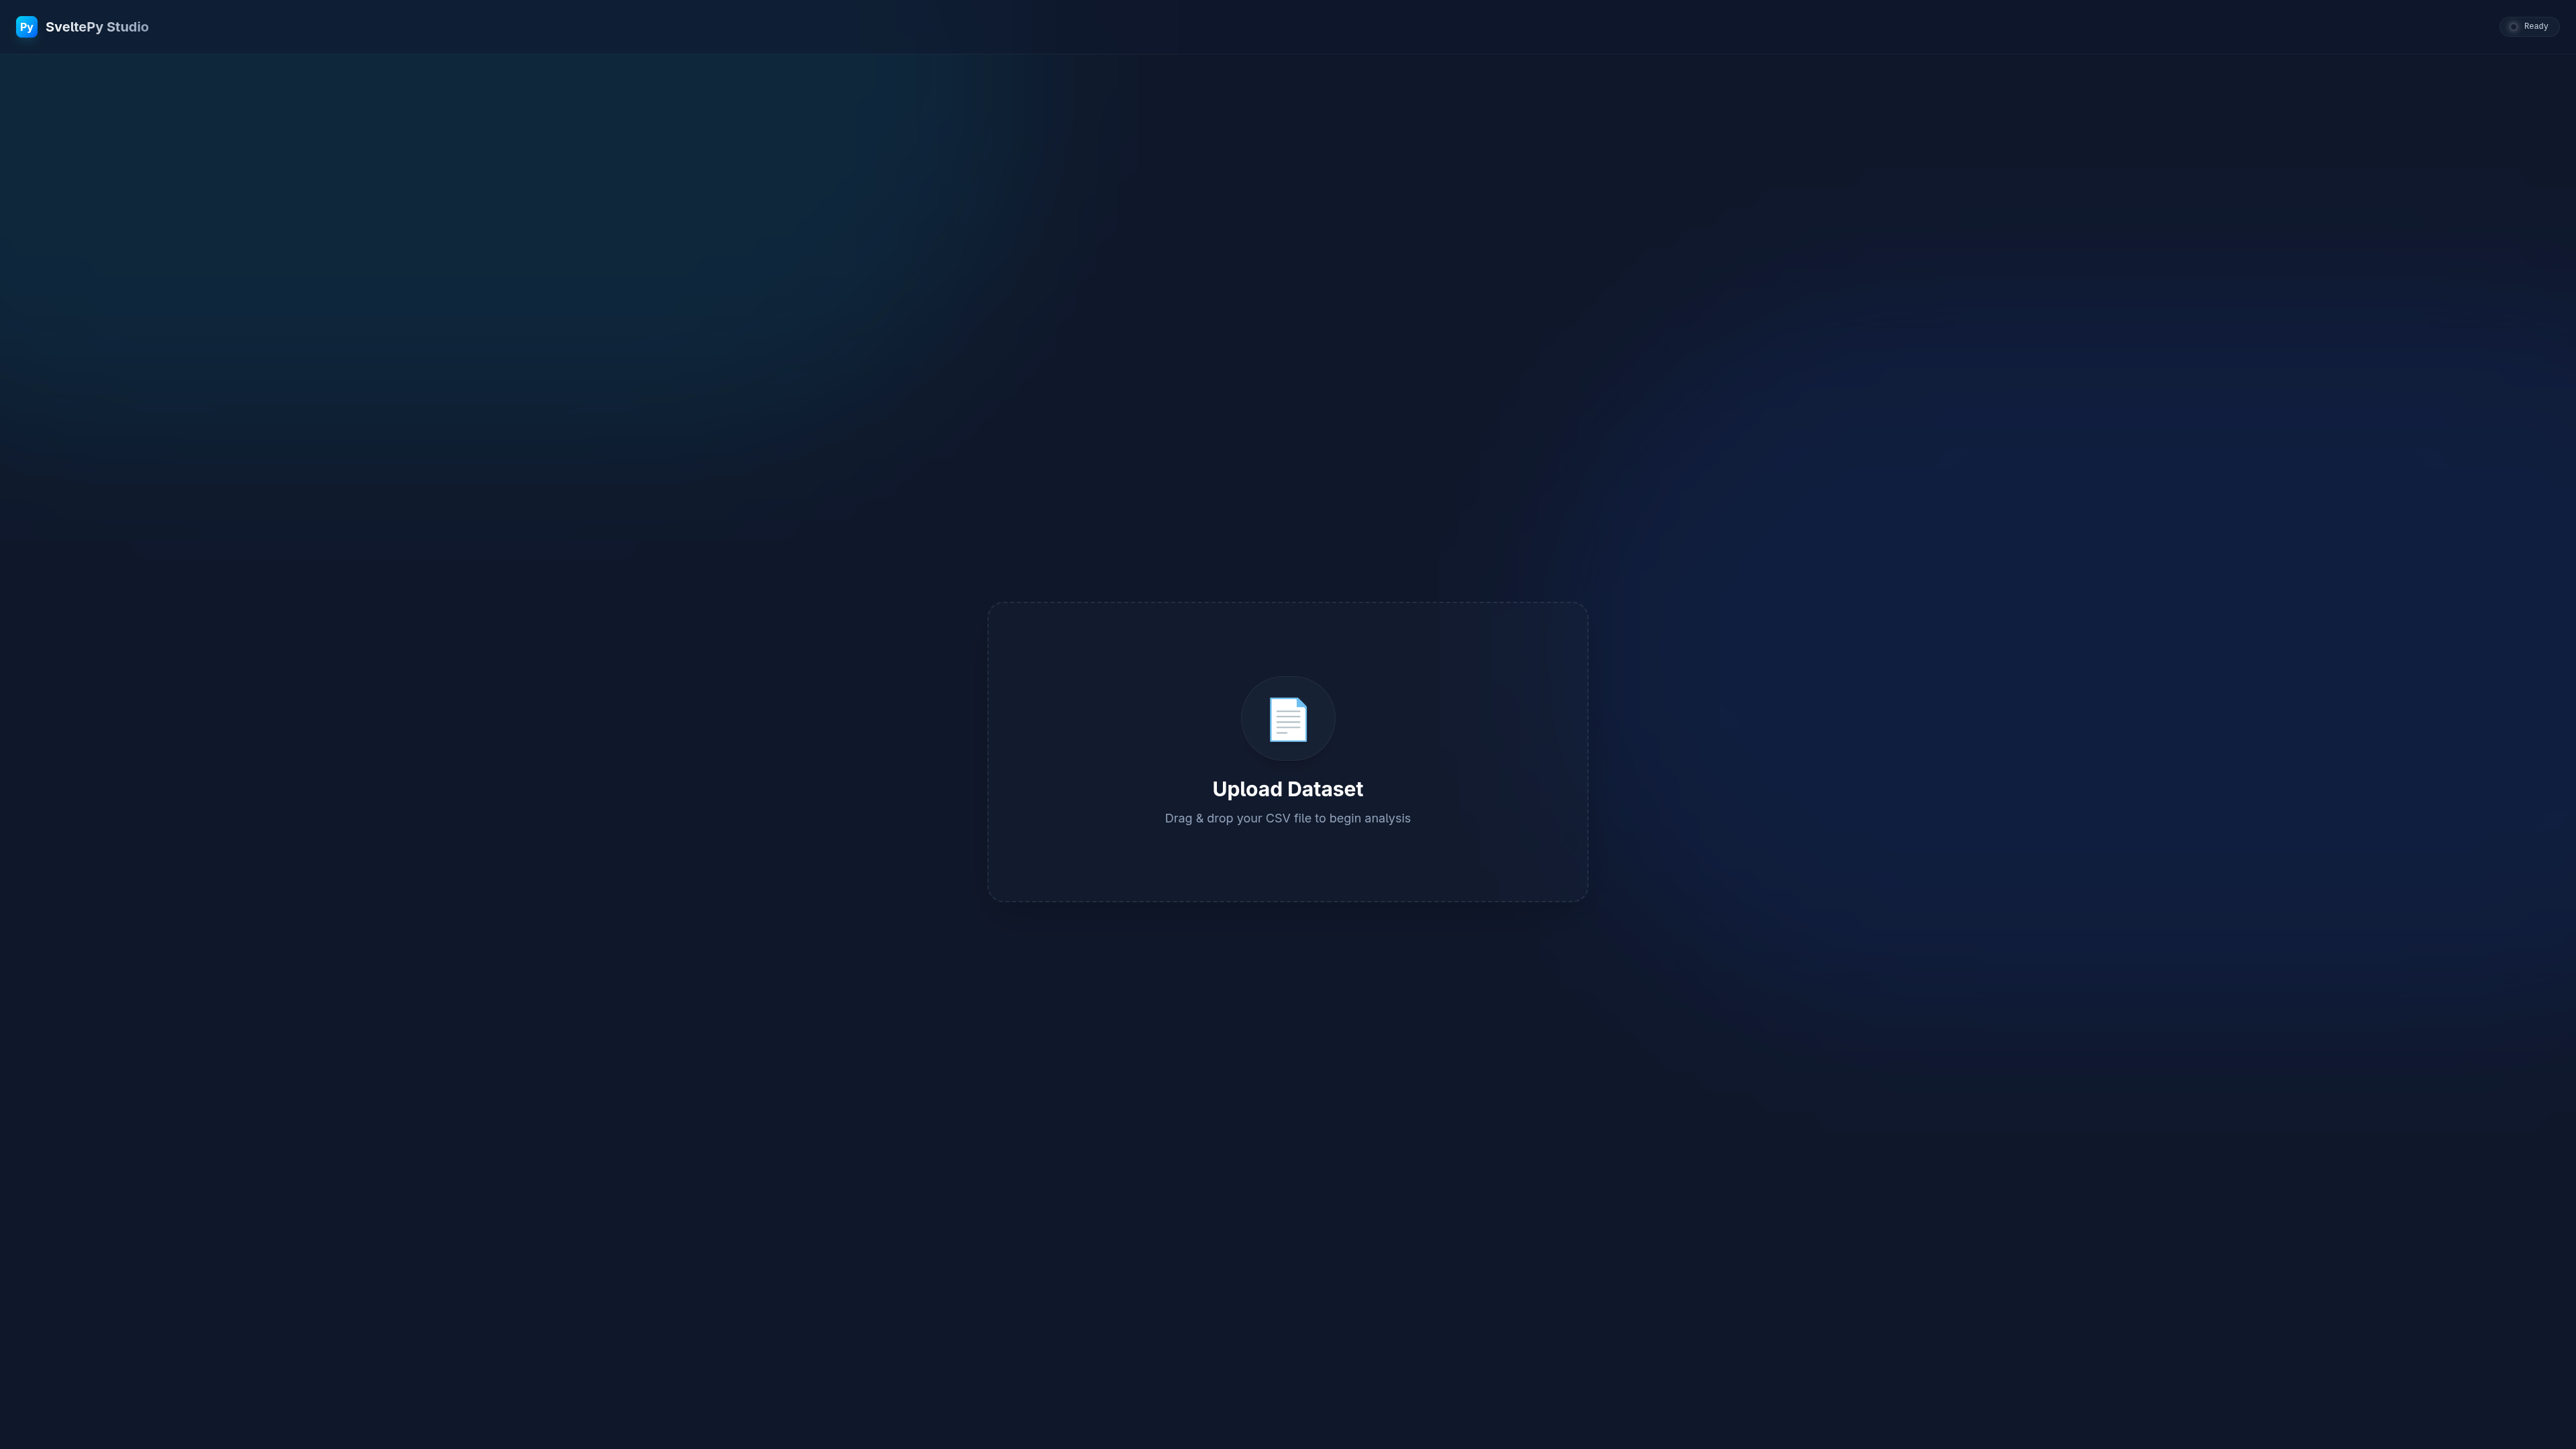
The workflow is simple:
- Upload: Drag and drop a CSV file.
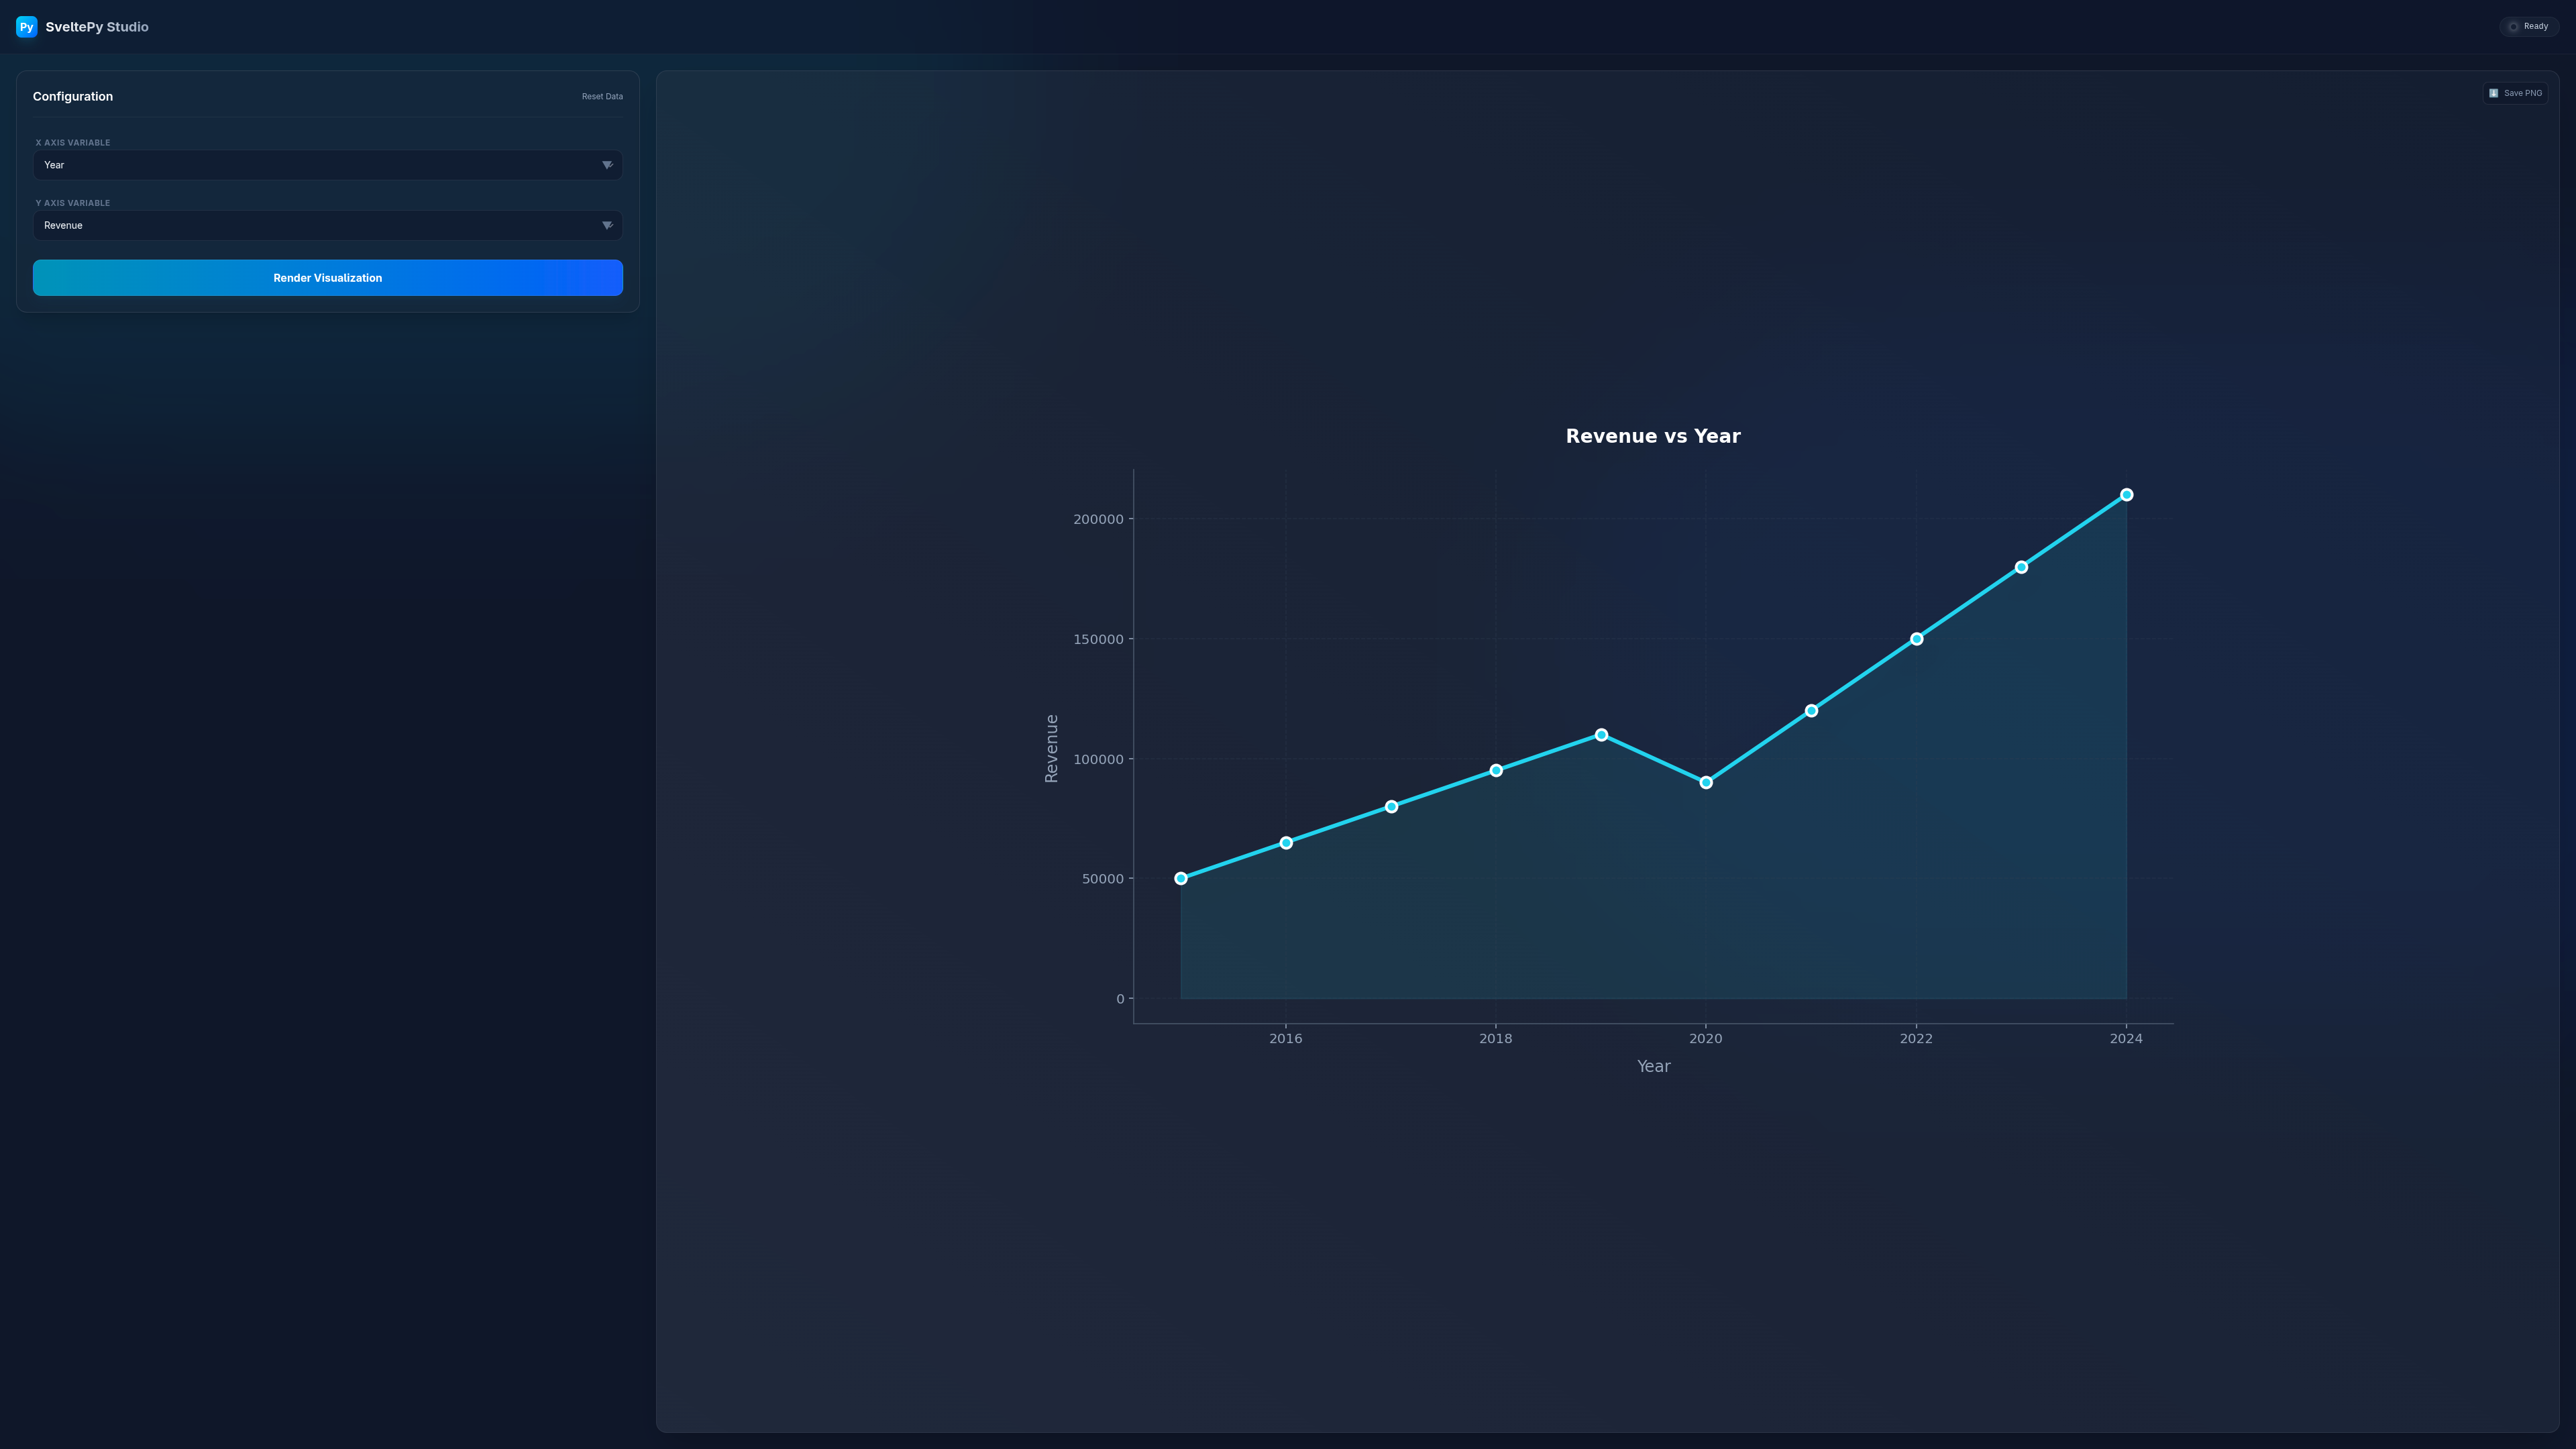
- Configure: Select which columns to plot on the X and Y axes.
- Visualize: The app feeds the data into a Python environment running locally in your browser, generating a Matplotlib chart.
Under the Hood
Running Python in the browser involves a few moving parts. Let’s break down the core technologies that make this possible.
1. WebAssembly (WASM) & Emscripten
At the bottom of the stack lies WebAssembly, a binary instruction format for a stack-based virtual machine which allows code written in languages such as C, C++, and Rust to run in the browser at near-native speeds.
Emscripten is the compiler toolchain that makes this possible. It takes the C source code of CPython (the standard Python interpreter) and compiles it into a .wasm binary. It also generates the necessary JavaScript “glue code” to let this binary talk to the browser APIs.
Pyodide builds on this by packaging the CPython interpreter along with popular data science libraries (NumPy, Pandas, Matplotlib) which have also been compiled to WebAssembly.
2. The Critical Role of Web Workers
Browsers are single-threaded by default. This means the JavaScript that updates your UI runs on the same thread as your event listeners.
If we were to run a heavy Python calculation (like parsing a large CSV with Pandas) on the main thread, the entire browser tab would freeze until the calculation finished. No buttons would click, no animations would play.
To solve this, we use Web Workers. A Web Worker is a separate background thread that runs in parallel to the main application. We spawn a worker to handle the Python environment, ensuring our UI remains responsive even while Python is crunching numbers.
3. The Virtual File System (VFS)
One of the trickiest parts of running C/C++ code in the browser is file I/O. Native applications expect a hard drive with paths like /home/user/data.csv, but the browser sandbox doesn’t allow direct access to the user’s filesystem.
Emscripten solves this by simulating a Virtual File System (VFS) in memory. To the Python code, it looks like a real filesystem.
For our demo, we use a special file system backend called WORKERFS. This is designed specifically for Web Workers and allows us to “mount” a browser File object directly into the virtual filesystem. This is highly efficient because it gives Python read-only access to the file data without needing to copy the entire file into memory first.
The Implementation: Inside worker.ts
Let’s look at how we orchestrate this in src/lib/worker.ts. This file lives in our Web Worker and handles all communication with the main UI.
Initialization
First, we load the Pyodide runtime and install our dependencies.
import { loadPyodide, type PyodideInterface } from 'pyodide';
import analysisScript from '$lib/analysis.py?raw';

async function _init(): Promise<PyodideInterface> {
    // Load the WASM binary
    pyodide = await loadPyodide({
        indexURL: '/pyodide/' // Served locally from our static folder
    });

    // Install packages (uses micropip under the hood)
    await pyodide.loadPackage(['pandas', 'matplotlib']);

    // Load our custom Python analysis logic
    await pyodide.runPythonAsync(analysisScript);

    return pyodide;
}
Zero-Copy File Mounting
When the user uploads a file, we don’t just send the data as a huge string. We pass the File object itself and mount it.
case 'LOAD_FILE': {
    const { file } = data;
    const MOUNT_DIR = '/data';

    // mount() expects an object where keys are filenames and values are File objects
    py.FS.mount(
        py.FS.filesystems.WORKERFS,
        { blobs: [{ name: 'source.csv', data: file }] },
        MOUNT_DIR
    );

    // Now Python can open('/data/source.csv') as if it were on a disk
    break;
}
Running the Analysis
Finally, to generate the plot, we simply call a function defined in our Python script.
case 'RUN_ANALYSIS': {
    const { xCol, yCol } = data;

    // Call the Python function 'generate_plot'
    // It returns a base64 encoded image string
    const generatePlot = py.globals.get('generate_plot');
    const result = generatePlot('/data/source.csv', xCol, yCol);

    // Send the image back to the main thread to be displayed
    postMessage({ type: 'RESULT', image: result });

    // Clean up memory
    generatePlot.destroy();
    break;
}
Client-Side Orchestration: +page.svelte
Now that we have a worker capable of running Python, we need a frontend to control it. This is where Svelte’s reactivity shines. We need to:
- Spawn the Worker when the component mounts.
- Send Messages to trigger file loading and analysis.
- Listen for Results to update the UI.
In src/routes/+page.svelte, we handle this lifecycle:
<script lang="ts">
  import { onMount, onDestroy } from 'svelte';
  // Vite's special syntax for importing a Web Worker constructor
  import Worker from '$lib/worker?worker';

  let worker: Worker;
  let status = "Initializing...";
  let plotImage: string | null = null;

  onMount(() => {
    // 1. Spawn the worker
    worker = new Worker();

    // 2. Set up the message listener
    worker.onmessage = (e) => {
      const { type, msg, image, error: errMsg } = e.data;

      if (type === "STATUS") status = msg;

      if (type === "RESULT") {
        // Matplotlib returns a base64 string, so we can display it directly
        plotImage = `data:image/png;base64,${image}`;
        status = "Ready";
      }
    };

    // 3. Kick off the Python initialization
    worker.postMessage({ type: "INIT" });
  });

  onDestroy(() => {
    // Cleanup is crucial! Terminate the worker when leaving the page.
    if (worker) worker.terminate();
  });
</script>
Handling User Interactions
When a user uploads a file or clicks “Render”, we simply pass a message to the worker. The UI doesn’t need to know how Python works, it just waits for a result.
  const handleFile = async (file: File) => {
    status = "Reading File...";
    // We pass the raw File object directly to the worker
    worker.postMessage({ type: "LOAD_FILE", data: { file } });
  };

  const runAnalysis = () => {
    status = "Generating Plot...";
    worker.postMessage({ type: "RUN_ANALYSIS", data: { xCol, yCol } });
  };
This pattern keeps our main thread completely free. The heavy lifting of parsing CSVs and generating plots happens in the background, while Svelte keeps the UI responsive, showing loading spinners or status updates based on the status variable.
The Python Side: analysis.py
Finally, we have the Python code itself. The beauty of this setup is that the Python code looks almost identical to what you would write in a Jupyter notebook.
There are only a few browser-specific adjustments we need to make:
1. No Display Server
Since we are running in a worker without a window system (like X11 or Wayland), we cannot use Matplotlib’s default interactive backend. We must set the backend to Agg (Anti-Grain Geometry), which is designed for rendering to image files.
import matplotlib
matplotlib.use("Agg") # Must be set before importing pyplot
import matplotlib.pyplot as plt
2. Reading from the VFS
Thanks to WORKERFS, reading the file is standard Pandas. The file path /data/source.csv maps to the exact bytes of the user’s uploaded file.
def generate_plot(file_path, x_col, y_col):
    # This reads directly from the uploaded file!
    df = pd.read_csv(file_path)

    # ... plotting logic ...
3. Returning the Image
We can’t just call plt.show(). Instead, we save the plot to an in-memory buffer (io.BytesIO), encode it as Base64, and return that string to JavaScript.
    # Save to memory buffer instead of disk
    buf = io.BytesIO()
    plt.savefig(buf, format='png', transparent=True, bbox_inches='tight')
    buf.seek(0)

    # Encode as base64 string
    img_str = base64.b64encode(buf.read()).decode('utf-8')

    # Clear the figure to free memory
    plt.clf()

    return img_str
Conclusion
This project proves that the web browser is becoming a capable environment for data science. By leveraging WebAssembly and Web Workers, we can bring the rich ecosystem of Python libraries to the client side, building apps that are:
- Privacy-focused: Data never leaves the user’s machine.
- Cost-effective: Zero backend infrastructure costs for data processing.
- Fast: No network latency for generating plots.
You can try it here with this CSV file
Source code for analysis.py
import pandas as pd
import matplotlib
import matplotlib.pyplot as plt
import io
import base64

matplotlib.use("Agg")

def get_columns(file_path):
    df = pd.read_csv(file_path)
    return list(df.columns)

def generate_plot(file_path, x_col, y_col):
    df = pd.read_csv(file_path)

    if x_col not in df.columns or y_col not in df.columns:
        raise ValueError(f"Columns '{x_col}' or '{y_col}' not found in dataset")

    df = df[[x_col, y_col]].dropna()

    try:
        df[x_col] = pd.to_numeric(df[x_col], errors='coerce')
        df[y_col] = pd.to_numeric(df[y_col], errors='coerce')
    except Exception:
        raise ValueError(f"Unable to convert columns to numeric values")

    df = df.dropna()

    if len(df) == 0:
        raise ValueError(f"No valid numeric data found in selected columns")

    df = df.sort_values(by=x_col)

    plt.style.use('dark_background')
    plt.rcParams.update({
        'axes.facecolor': '#1e293b',
        'figure.facecolor': '#1e293b',
        'grid.color': '#334155',
        'text.color': '#e2e8f0',
        'axes.labelcolor': '#94a3b8',
        'xtick.color': '#94a3b8',
        'ytick.color': '#94a3b8',
        'font.family': 'sans-serif'
    })

    fig, ax = plt.subplots(figsize=(12, 7), dpi=144)

    ax.grid(True, linestyle='--', alpha=0.3)
    ax.spines['top'].set_visible(False)
    ax.spines['right'].set_visible(False)
    ax.spines['left'].set_color('#475569')
    ax.spines['bottom'].set_color('#475569')

    ax.plot(df[x_col], df[y_col],
            marker='o', markersize=8, linewidth=3,
            color='#22d3ee', markeredgecolor='white', markeredgewidth=2)
    ax.fill_between(df[x_col], df[y_col], alpha=0.1, color='#22d3ee')

    ax.set_title(f'{y_col} vs {x_col}', color='white', pad=20,
                 fontsize=14, fontweight='bold')
    ax.set_xlabel(x_col, fontsize=12, labelpad=10)
    ax.set_ylabel(y_col, fontsize=12, labelpad=10)

    plt.tight_layout()

    buf = io.BytesIO()
    plt.savefig(buf, format='png', transparent=True, bbox_inches='tight')
    buf.seek(0)

    img_str = base64.b64encode(buf.read()).decode('utf-8')

    plt.close(fig)

    return img_str
Source code for worker.ts
"use strict";
import { loadPyodide, type PyodideInterface } from 'pyodide';
import analysisScript from '$lib/analysis.py?raw';

let pyodide: PyodideInterface | null = null;
let initPromise: Promise<PyodideInterface> | null = null;

const MOUNT_DIR = '/data';

async function _init(): Promise<PyodideInterface> {
	postMessage({ type: 'STATUS', msg: 'Loading Python Kernel...' });

	pyodide = await loadPyodide({ indexURL: '/pyodide/' });

	postMessage({ type: 'STATUS', msg: 'Installing Pandas & Matplotlib...' });
	await pyodide.loadPackage(['pandas', 'matplotlib']);
	await pyodide.runPythonAsync(analysisScript);

	try {
		pyodide.FS.mkdir(MOUNT_DIR);
	} catch (e) {
		if (!String(e).includes('exists')) {
			console.warn(`Failed to create directory: ${e}`);
		}
	}

	postMessage({ type: 'STATUS', msg: 'Ready' });
	postMessage({ type: 'READY' });

	return pyodide;
}

async function getPyodide(): Promise<PyodideInterface> {
	if (!initPromise) {
		initPromise = _init();
	}
	return await initPromise;
}

function cleanupProxy(proxy: any): void {
	if (proxy?.destroy) {
		proxy.destroy();
	}
}

self.onmessage = async (event) => {
	const { type, data } = event.data;

	try {
		if (type === 'INIT') {
			await getPyodide();
			return;
		}

		const py = await getPyodide();

		switch (type) {
			case 'LOAD_FILE': {
				const { file } = data;
				const fileName = 'source.csv';
				const filePath = `${MOUNT_DIR}/${fileName}`;

				try {
					py.FS.unmount(MOUNT_DIR);
				} catch (e) {
					if (!String(e).includes('not a mountpoint')) {
						console.warn(`Unmount failed: ${e}`);
					}
				}

				py.FS.mount(
					py.FS.filesystems.WORKERFS,
					{ blobs: [{ name: fileName, data: file }] },
					MOUNT_DIR
				);

				const getColumns = py.globals.get('get_columns');
				const columnsProxy = getColumns(filePath);
				const columns = columnsProxy.toJs();

				cleanupProxy(columnsProxy);
				cleanupProxy(getColumns);

				postMessage({ type: 'FILE_LOADED', columns });
				break;
			}

			case 'RUN_ANALYSIS': {
				const { xCol, yCol } = data;
				const filePath = `${MOUNT_DIR}/source.csv`;

				postMessage({ type: 'STATUS', msg: 'Processing Data...' });

				const generatePlot = py.globals.get('generate_plot');
				const resultProxy = generatePlot(filePath, xCol, yCol);
				const imageData = String(resultProxy);

				cleanupProxy(resultProxy);
				cleanupProxy(generatePlot);

				postMessage({ type: 'RESULT', image: imageData });
				break;
			}

			default:
				console.warn(`Unknown message type: ${type}`);
		}
	} catch (err) {
		console.error('Worker error:', err);
		postMessage({
			type: 'ERROR',
			error: err instanceof Error ? err.message : String(err)
		});
	} finally {
		if (type !== 'INIT') {
			postMessage({ type: 'STATUS', msg: 'Ready' });
		}
	}
};
Source code for +page.svelte
<script lang="ts">
  import { onMount, onDestroy } from 'svelte';
  import Worker from '$lib/worker?worker';

  let worker: Worker;
  let status = "Initializing...";
  let isReady = false;
  let isProcessing = false;
  let plotImage: string | null = null;
  let error: string | null = null;
  let fileLoaded = false;
  let columns: string[] = [];
  let xCol = "";
  let yCol = "";

  $: statusColor = isReady && !isProcessing ? 'emerald' : 'amber';
  $: statusPulse = !isReady || isProcessing;

  onMount(() => {
    worker = new Worker();

    worker.onmessage = (e) => {
      const { type, msg, image, error: errMsg, columns: cols } = e.data;

      switch (type) {
        case "STATUS":
          status = msg;
          isProcessing = msg === "Processing Data..." ||
            msg.includes("Loading") ||
            msg.includes("Installing");
          break;

        case "READY":
          isReady = true;
          status = "Ready";
          isProcessing = false;
          break;

        case "FILE_LOADED":
          columns = cols;
          fileLoaded = true;
          isProcessing = false;
          status = "File Mounted";

          if (columns.length >= 2) {
            [xCol, yCol] = columns;
          }
          break;

        case "RESULT":
          plotImage = `data:image/png;base64,${image}`;
          status = "Ready";
          isProcessing = false;
          break;

        case "ERROR":
          error = errMsg;
          status = "Error";
          isProcessing = false;
          break;
      }
    };

    worker.postMessage({ type: "INIT" });
  });

  onDestroy(() => {
    worker?.terminate();
  });

  const handleFile = async (file: File) => {
    if (!file.name.toLowerCase().endsWith('.csv')) {
      error = 'Please select a CSV file';
      return;
    }

    error = null;
    plotImage = null;
    isProcessing = true;
    status = "Reading File...";
    worker.postMessage({ type: "LOAD_FILE", data: { file } });
  };

  const onDrop = (e: DragEvent) => {
    e.preventDefault();
    const file = e.dataTransfer?.files[0];
    if (file) handleFile(file);
  };

  const onDragOver = (e: DragEvent) => {
    e.preventDefault();
  };

  const triggerFileInput = () => {
    document.getElementById('fileInput')?.click();
  };

  const onFileSelected = (e: Event) => {
    const file = (e.target as HTMLInputElement).files?.[0];
    if (file) handleFile(file);
  };

  const runAnalysis = () => {
    if (!fileLoaded || !xCol || !yCol) return;

    plotImage = null;
    isProcessing = true;
    status = "Generating Plot...";
    worker.postMessage({ type: "RUN_ANALYSIS", data: { xCol, yCol } });
  };

  const resetData = () => {
    fileLoaded = false;
    plotImage = null;
    error = null;
  };
</script>

<div class="min-h-screen bg-[#0f172a] text-slate-100 flex flex-col font-sans selection:bg-cyan-500/30 relative">

  {#if !isReady && !fileLoaded}
    <div class="fixed inset-0 z-50 bg-[#0f172a] flex flex-col items-center justify-center">
      <div class="relative mb-8">
        <div class="w-24 h-24 rounded-full border-4 border-slate-800"></div>
        <div class="absolute inset-0 w-24 h-24 rounded-full border-4 border-t-cyan-500 border-r-transparent border-b-transparent border-l-transparent animate-spin"></div>
        <div class="absolute inset-0 flex items-center justify-center">
          <span class="text-2xl">🐍</span>
        </div>
      </div>
      <h2 class="text-2xl font-bold bg-clip-text text-transparent bg-gradient-to-r from-cyan-400 to-blue-500 mb-2">
        Setting up Environment
      </h2>
      <p class="text-slate-400 font-mono text-sm">{status}</p>
    </div>
  {/if}

  <div class="fixed inset-0 overflow-hidden pointer-events-none">
    <div class="absolute -top-[20%] -left-[10%] w-[50%] h-[50%] rounded-full bg-cyan-500/10 blur-[120px]"></div>
    <div class="absolute top-[20%] -right-[10%] w-[50%] h-[50%] rounded-full bg-blue-600/10 blur-[120px]"></div>
  </div>

  <header class="relative z-10 w-full p-6 border-b border-white/5 bg-slate-900/50 backdrop-blur-md flex justify-between items-center">
    <div class="flex items-center gap-3">
      <div class="w-8 h-8 rounded-lg bg-gradient-to-br from-cyan-400 to-blue-600 flex items-center justify-center text-white font-bold shadow-lg shadow-cyan-900/50">
        Py
      </div>
      <h1 class="text-xl font-bold bg-clip-text text-transparent bg-gradient-to-r from-white to-slate-400">
        SveltePy Studio
      </h1>
    </div>

    <div class="flex items-center gap-3 px-4 py-1.5 rounded-full bg-slate-800/50 border border-white/5 text-xs font-mono transition-all duration-300">
      <div class={`w-2 h-2 rounded-full shadow-[0_0_10px_currentColor] transition-colors duration-300 bg-${statusColor}-400 text-${statusColor}-400 ${statusPulse ? 'animate-pulse' : ''}`}></div>
      <span class="text-slate-300">{status}</span>
    </div>
  </header>

  <main class="relative z-10 flex-1 w-full h-full p-4 md:p-6 flex flex-col">
    {#if !fileLoaded}
      <div class="flex-1 flex items-center justify-center">
        <input
          type="file"
          id="fileInput"
          class="hidden"
          accept=".csv"
          onchange={onFileSelected}
        />


        <div
          role="button"
          tabindex="0"
          aria-label="File Upload Drop Zone"
          ondragover={onDragOver}
          ondrop={onDrop}
          onclick={triggerFileInput}
          class="w-full max-w-4xl aspect-[2/1] border-2 border-dashed border-slate-700/50 rounded-3xl flex flex-col items-center justify-center gap-6 bg-slate-800/20 backdrop-blur-sm hover:border-cyan-500/50 hover:bg-slate-800/40 transition-all duration-300 cursor-pointer group shadow-2xl shadow-black/20 relative overflow-hidden focus:outline-none focus:ring-2 focus:ring-cyan-500/50"
        >
          {#if isProcessing}
            <div class="absolute inset-0 bg-slate-900/80 backdrop-blur-sm z-20 flex flex-col items-center justify-center">
              <div class="w-12 h-12 border-4 border-cyan-500/30 border-t-cyan-500 rounded-full animate-spin mb-4"></div>
              <p class="text-cyan-400 font-medium">Reading CSV...</p>
            </div>
          {/if}

          <div class="p-8 rounded-full bg-slate-800/50 group-hover:scale-110 transition-transform duration-300 border border-white/5 shadow-xl">
            <span class="text-6xl drop-shadow-lg">📄</span>
          </div>
          <div class="text-center">
            <h3 class="text-3xl font-bold text-white mb-3">Upload Dataset</h3>
            <p class="text-slate-400 text-lg">Drag & drop your CSV file to begin analysis</p>
          </div>
        </div>
      </div>
    {:else}
      <div class="w-full flex-1 grid grid-cols-1 lg:grid-cols-12 gap-6 h-full animate-fade-in">
        <div class="lg:col-span-3 space-y-6 flex flex-col h-full">
          <div class="bg-slate-800/40 backdrop-blur-xl p-6 rounded-2xl border border-white/10 shadow-xl flex-none">
            <div class="flex justify-between items-center mb-6 border-b border-white/5 pb-4">
              <h2 class="font-semibold text-lg text-white">Configuration</h2>
              <button
                onclick={resetData}
                class="text-xs text-slate-400 hover:text-cyan-400 transition-colors"
              >
                Reset Data
              </button>
            </div>

            <div class="space-y-5">
              <div class="space-y-2">
                <label for="x-axis" class="text-xs font-bold text-slate-500 uppercase tracking-wider ml-1">
                  X Axis Variable
                </label>
                <div class="relative">
                  <select
                    id="x-axis"
                    bind:value={xCol}
                    class="w-full appearance-none bg-slate-900/60 border border-slate-700/50 rounded-xl px-4 py-3 text-sm focus:ring-2 focus:ring-cyan-500/50 focus:border-cyan-500/50 outline-none transition-all hover:bg-slate-900/80"
                  >
                    {#each columns as col (col)}
                      <option value={col}>{col}</option>
                    {/each}
                  </select>
                  <div class="absolute right-4 top-1/2 -translate-y-1/2 pointer-events-none text-slate-500">▼</div>
                </div>
              </div>

              <div class="space-y-2">
                <label for="y-axis" class="text-xs font-bold text-slate-500 uppercase tracking-wider ml-1">
                  Y Axis Variable
                </label>
                <div class="relative">
                  <select
                    id="y-axis"
                    bind:value={yCol}
                    class="w-full appearance-none bg-slate-900/60 border border-slate-700/50 rounded-xl px-4 py-3 text-sm focus:ring-2 focus:ring-cyan-500/50 focus:border-cyan-500/50 outline-none transition-all hover:bg-slate-900/80"
                  >
                    {#each columns as col (col)}
                      <option value={col}>{col}</option>
                    {/each}
                  </select>
                  <div class="absolute right-4 top-1/2 -translate-y-1/2 pointer-events-none text-slate-500">▼</div>
                </div>
              </div>

              <button
                onclick={runAnalysis}
                disabled={!isReady || isProcessing}
                class="w-full mt-2 bg-gradient-to-r from-cyan-600 to-blue-600 hover:from-cyan-500 hover:to-blue-500 disabled:opacity-50 disabled:cursor-not-allowed text-white font-bold py-3.5 rounded-xl transition-all shadow-lg shadow-cyan-900/20 active:scale-[0.98] border border-white/10"
              >
                {#if isProcessing}
                  <span class="flex items-center justify-center gap-2">
                    <div class="w-4 h-4 border-2 border-white/30 border-t-white rounded-full animate-spin"></div>
                    Processing...
                  </span>
                {:else}
                  Render Visualization
                {/if}
              </button>
            </div>
          </div>
        </div>

        <div class="lg:col-span-9 bg-slate-800/40 backdrop-blur-xl rounded-2xl border border-white/10 shadow-2xl overflow-hidden flex items-center justify-center relative group min-h-[600px] h-full">
          <div class="absolute inset-0 bg-gradient-to-tr from-white/5 to-transparent pointer-events-none"></div>

          {#if isProcessing}
            <div class="absolute inset-0 z-20 bg-slate-900/60 backdrop-blur-sm flex flex-col items-center justify-center gap-4 animate-fade-in">
              <div class="relative">
                <div class="w-20 h-20 border-4 border-cyan-500/30 border-t-cyan-500 rounded-full animate-spin"></div>
                <div class="absolute inset-0 blur-xl bg-cyan-500/20 rounded-full"></div>
              </div>
              <div class="text-center">
                <p class="text-lg font-bold text-white mb-1">Crunching Data</p>
                <p class="text-slate-400 text-sm font-mono">
                  Running Python {status === "Processing Data..." ? "Script" : "Kernel"}...
                </p>
              </div>
            </div>
          {/if}

          {#if plotImage && !isProcessing}
            <div class="relative w-full h-full p-6 animate-fade-in flex items-center justify-center">
              <img src={plotImage} alt="Data Visualization Plot" class="max-w-full max-h-full object-contain drop-shadow-2xl" />
              <div class="absolute top-4 right-4 opacity-0 group-hover:opacity-100 transition-opacity">
                <a
                  href={plotImage}
                  download="plot.png"
                  class="bg-slate-900/80 p-2 rounded-lg text-slate-400 hover:text-white border border-white/10 text-xs flex items-center gap-2 transition-colors"
                >
                  <span>⬇</span> Save PNG
                </a>
              </div>
            </div>
          {:else if !isProcessing}
            <div class="text-slate-600 text-center">
              <div class="text-8xl mb-6 opacity-30">📊</div>
              <p class="text-2xl font-bold text-slate-500 mb-2">Visualization Area</p>
              <p class="text-slate-600">Select variables on the left to generate insights</p>
            </div>
          {/if}

          {#if error}
            <div class="absolute inset-0 bg-slate-900/95 backdrop-blur-sm flex items-center justify-center p-8 text-center z-30 animate-fade-in">
              <div class="bg-red-500/10 border border-red-500/20 p-8 rounded-2xl max-w-lg">
                <div class="text-5xl mb-4">⚠️</div>
                <h3 class="text-red-400 font-bold text-xl mb-3">Error</h3>
                <p class="text-red-200/80 text-sm mb-6 bg-black/20 p-4 rounded-lg">
                  {error}
                </p>
                <button
                  onclick={() => error = null}
                  class="px-6 py-2 bg-red-500 hover:bg-red-400 text-white rounded-lg font-medium transition-colors shadow-lg shadow-red-900/20"
                >
                  Dismiss
                </button>
              </div>
            </div>
          {/if}
        </div>
      </div>
    {/if}
  </main>
</div>